
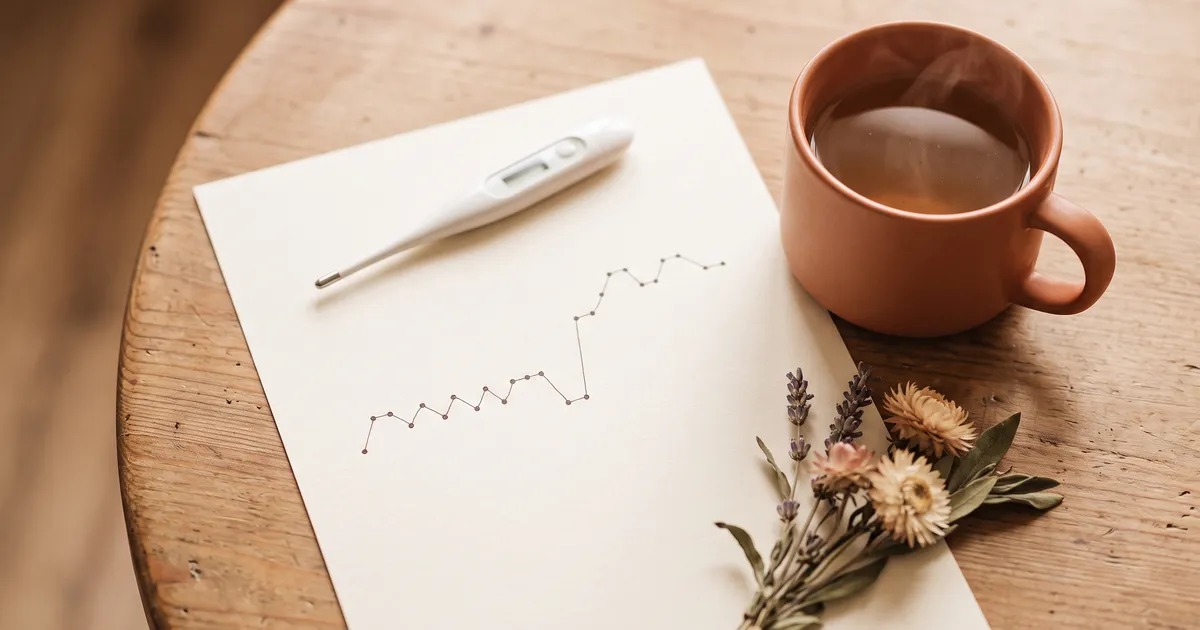
Basal body temperature sounds straightforward on paper: a thermometer, a reading every morning, done. In practice, a few small details determine whether your chart is useful or just a jagged line. Taking consistent measurements matters more than collecting as many numbers as possible.
This article explains both how to take comparable readings and what a temperature chart can tell you. Just as important is what it cannot tell you: a rise is a retrospective sign, not advance notice of the next ovulation.
What basal body temperature means
Basal body temperature, often shortened to BBT, is your temperature at complete rest. For everyday charting, you measure it immediately after waking, before getting up or becoming active. It is a practical approximation of your resting baseline, rather than a guarantee that you have captured the absolute lowest temperature of the day.
Across an ovulatory cycle, this baseline can follow a recognisable pattern. The difference is small: a few tenths of a degree Celsius, not a fever. The German article describes an approximate rise of 0.2–0.5 °C; the size of your own shift can differ. A suitable thermometer and a consistent routine help you see that change without mistaking measurement noise for a hormonal signal.
Why temperature rises after ovulation
After an egg is released, the remaining follicle becomes the corpus luteum and produces progesterone. Progesterone has a warming effect, which can raise resting temperature.
This often creates two levels in a chart:
- During the follicular phase, from the start of the period until ovulation, readings are generally lower.
- During the luteal phase, after ovulation and before the next period, progesterone is associated with a higher temperature level.
The shift usually becomes apparent after ovulation, but its timing does not pinpoint the exact moment of egg release. The higher level can persist while progesterone remains elevated. As progesterone falls before a period, temperature often falls too. Pregnancy is one possible reason for a sustained high level, discussed below.
For the broader hormonal picture, see our guide to the four cycle phases.
How to measure consistently
A misleading chart is frustrating, so establish a routine you can actually keep. You do not have to interpret every number as soon as you take it. Record first, then look for a pattern across several days.
When: after waking, before getting up
Take the reading while still lying down, before talking, drinking or starting your morning activities. Keep the thermometer within reach so you do not need to get out of bed to find it.
Aim for a similar waking and measurement time. The German guide suggests a window of about ±30 minutes and four to five hours of uninterrupted sleep as a practical routine; these are not universal interpretation rules. Follow the instructions of the method you are learning. If you sleep in, wake much earlier or have interrupted sleep, record that alongside the reading rather than trying to “correct” the number yourself.
What to use: a suitable thermometer
A basal thermometer displaying two decimal places, such as 36.54 °C, makes small changes easier to record. Display resolution alone does not guarantee accuracy: choose a device suitable for basal measurements and follow its instructions.
Use the same device throughout a cycle. Switching thermometers can introduce a difference that has nothing to do with ovulation. If a replacement is unavoidable, note it clearly in your chart.
Where: choose one measurement site
Oral, vaginal and rectal measurement are possible, depending on the thermometer and the method. For oral readings, place the thermometer as instructed under the tongue. Breathing through an open mouth can affect an oral measurement.
The important point is consistency. Do not alternate between sites within a cycle and compare the readings as if they were interchangeable. Follow the device and method instructions for measurement duration; a beep does not replace any additional timing requirement of the method you use.
What can disturb a reading?
Make a note of circumstances that may affect temperature or comparability:
- Alcohol the previous evening.
- Too little sleep or a restless, interrupted night.
- Shift work or a major change in sleeping hours.
- Illness or fever.
- Taking the reading at a very different time, or after getting up.
A notes column is therefore as useful as the temperature column. One unusually high value does not establish ovulation. Equally, do not automatically discard every inconvenient result: use the evaluation rules of your method rather than adjusting a chart to fit your expectations.
Reading the chart
A biphasic pattern
“Biphasic” means that the chart has two temperature levels. Readings fluctuate around a lower level first, then several readings establish a higher level. This can be consistent with ovulation having occurred.
If no shift is visible, possible explanations include an anovulatory cycle, disturbed measurements or a pattern that is hard to interpret. A home chart alone does not diagnose the cause. Repeatedly unclear charts, particularly alongside other cycle changes, are worth discussing with a healthcare professional.
What is a coverline?
A coverline is a horizontal reference line used to make a temperature shift easier to see. The general idea is to compare a run of higher readings with the earlier lower level.
Structured methods have detailed rules for doing this. You may encounter descriptions such as three higher readings compared with the previous six days, but this shorthand leaves out thresholds, exceptions and other observations. It is not a complete contraceptive rule. Learn the full method rather than drawing a line wherever the chart looks convincing.
An example in words
Imagine a 28-day cycle. From day 1 to around day 13, readings fluctuate around 36.3–36.5 °C. In this example, ovulation occurs around day 14. From day 15 or 16, readings rise to around 36.7–36.9 °C and remain at a higher level through the luteal phase. Around day 27 or 28, they fall again and a period follows.
These numbers illustrate a pattern; they are not target temperatures or a timetable your body must follow. On the first higher day, you cannot yet know whether you are seeing a sustained shift or an isolated outlier. The interpretation becomes clearer only after subsequent readings.
Temperature and pregnancy
A temperature level that remains elevated beyond the expected luteal phase, especially when a period is late, can prompt a pregnancy test. A sustained rise for around 18 days after suspected ovulation is sometimes described as an early clue. It is not a diagnosis.
In early pregnancy, progesterone production is maintained, which can keep temperature elevated. Some charts appear to show a third, still higher level, but a “triphasic” pattern is neither necessary nor reliable proof of pregnancy.
A pregnancy test, used according to its instructions, is the appropriate way to check. Do not wait for a particular chart shape before testing if your period is late. Seek medical advice when needed; temperature cannot confirm that a pregnancy is progressing normally.
What temperature cannot tell you
A sustained temperature rise supports retrospective interpretation; it does not announce ovulation in advance. By the time the higher level is established, the most fertile days of that cycle may already have passed. Past charts can help you recognise patterns, but the next cycle can differ.
Symptothermal methods combine temperature with other observations, such as cervical mucus, using defined rules. The original German article points to Sensiplan and the German family-planning information portal as starting points. These are German-language resources.
This article is not a contraception tutorial. If you want to use fertility awareness to avoid pregnancy, learn an established method with qualified guidance. Temperature alone and calendar estimates should not be treated as contraception. If you are trying to conceive, a clinician or trained fertility-awareness adviser can help you understand the observations and their limits.
Estimating ovulation without a thermometer
Daily measurements are not for everyone. For a quick calendar estimate, our free ovulation calculator asks for the first day of your last period and your usual cycle length. It provides an estimated ovulation window and fertile days without an account, app or email address.
Its approximate calculation is estimated ovulation day ≈ cycle length minus 14. This assumes a luteal phase of about 14 days; actual luteal length varies. Stress, illness, travel and other changes can make the estimate inaccurate. The calculator does not detect ovulation and is not a contraceptive method.
The cycle-phase overview explains all four phases and possible changes in appetite or how you feel, without assuming everyone experiences the same pattern. Calendar estimates offer an overview; temperature observations add information about the cycle that actually occurred. Neither replaces a clinical assessment when one is needed.
Bauchgefühl offers cycle tracking, symptom logging and phase predictions. It does not have dedicated basal-temperature tracking. Use an appropriate thermometer and a suitable record for that purpose. The app is available in German and English.
Frequently asked questions
How long do I need to measure before seeing a pattern?
Allow at least one complete cycle, and often two or three, to become familiar with your own readings. One chart may show a shift, but several cycles give more context about your usual variation. This learning period does not establish contraceptive protection.
Does it have to be at exactly the same time every day?
A reasonably consistent time helps. The ±30-minute window suggested in the German guide is a practical reference, not a universal rule. Record substantial changes in timing and follow your chosen method’s instructions for interpretation.
My chart is very jagged. Am I doing something wrong?
Some day-to-day variation is normal. Look at the broader pattern, and review changes in sleep, alcohol, illness, timing, measurement site or device. An irregular chart does not by itself prove that you measured incorrectly or that you did not ovulate.
Can I use basal temperature for contraception?
Do not rely on temperature alone or on the simplified explanation here. An established symptothermal method combines observations and requires learning its full rules. Seek qualified advice if avoiding pregnancy is your aim.
What does a drop before my period mean?
A fall in progesterone before menstruation can be accompanied by a temperature drop. The timing varies, and a single low value cannot reliably predict the exact start of bleeding. If a period is late, use a pregnancy test according to its instructions rather than relying on temperature alone.
Putting it into practice
The useful routine is simple: a suitable thermometer, consistent timing and measurement site, and notes about disturbed readings. Over several cycles, you may recognise a lower and a higher level and better understand your own pattern.
Keep the distinction between estimation and observation in mind. A calendar offers a forecast based on averages; a temperature chart provides retrospective clues. Neither gives certainty about the exact day of ovulation, pregnancy or contraception on its own.
Further reading:
This article is general information, not medical advice or contraceptive instruction. For pregnancy planning, contraception or concerning cycle changes, speak with a healthcare professional or a qualified fertility-awareness adviser.